

In this article:
We’ll explain how manufacturers can use real-time business intelligence to monitor performance, improve decisions, choose meaningful KPIs, and turn operational data into action.



Manufacturers have more data available to them than ever before. Production activity, inventory movements, labor hours, job costs, purchasing records, quality results, and financial information all provide valuable insights into how a business is performing.
But having data is not the same as being able to use it.
When information is buried in spreadsheets, divided between systems, or only available through reports created after the fact, manufacturers can struggle to see what is happening in time to make a difference. Business intelligence turns operational data into clear, timely information that helps teams recognize problems, set priorities, and make better decisions.
We spoke with two Genius ERP customers—Kaleb James, Managing Director of Stafford Engineering, and Mathieu Robert, President & CEO of G.M. Precision—about how business intelligence and key performance indicators are helping their companies make better use of their data.

We’ll explain how manufacturers can use real-time business intelligence to monitor performance, improve decisions, choose meaningful KPIs, and turn operational data into action.
Business intelligence, commonly called BI, refers to the tools and processes used to collect, organize, analyze, and present business data. For manufacturers, that data can come from across the operation, including production, inventory, purchasing, sales, quality, job costing, and finance.
BI tools turn this information into dashboards, reports, metrics, and key performance indicators that make it easier to understand how the business is performing.
Business intelligence and analytics are closely related. BI helps manufacturers monitor operations and understand what is happening, while analytics helps them examine performance, identify patterns, and determine where improvements can be made. Together, they help manufacturers move from collecting data to using it.
The goal is not to track every possible number. It is to give the right people access to information they can use to make better decisions.

Many manufacturers rely on KPIs that show what happened last week, last month, or after a job has already been completed.
“Most businesses track KPIs that exist in the past—the ‘what has happened’—not ‘what is currently happening,’” says Kaleb. “They tend to be financial ones, such as job costs or gross margins or what you see in your profit and loss or management accounts, a few weeks after you have any chance to influence the outcome.”
Financial reports, job-cost summaries, and margin analyses are important, but by the time they are reviewed, it may be too late to influence the result.
At G.M. Precision, real-time production data helped the team uncover inefficiencies that were difficult to see using its previous approach.
“By using real-time data collected from our production machines, we realized that our method for validating actual machining time could be skewed due to various factors that delay production. Real-time machine status monitoring software allowed us to determine the actual hourly unit production time, including time losses caused by both planned and unplanned equipment downtime,” says Mathieu.
Moving from after-the-fact reporting to live visibility helped the G.M. Precision team improve efficiency and productivity.
This is where real-time BI becomes especially valuable. Instead of waiting for a report to confirm that a problem occurred, manufacturers can see conditions changing and respond sooner. A production manager may notice a rising scrap rate, a bottleneck forming at a work center, or a job falling behind schedule—and take action before the problem becomes more expensive or affects delivery.
Business intelligence is only useful if people can access and understand the information it provides.
A good BI system should make important information easy to find without requiring users to sort through large reports or build complicated spreadsheets. Dashboards can bring together the KPIs that matter most to a department, role, or individual and present them in a clear, visual format.
“Too often data is hard to visualize, hard to get to, or worse yet, locked away so that it’s not readily available,” says Kaleb. “A good BI toolkit will allow you to surface the things that matter to you most. This could be as simple as visualizing any materials that have been ordered and are now due or overdue, so procurement can focus on following up suppliers, ensuring the material is ready when the guys doing the work need it, boosting efficiency and throughput.”
“The key here,” emphasizes Kaleb, “is that it should always be available and up to date, as opposed to a report that needs to be run and then sorted through.”
Instead of relying on reports, Stafford Engineering installed TVs around their shop floor, displaying up-to-the-minute KPIs where everyone can see them. “We have found that the small outlay in some internet-ready large screen TVs displaying KPIs in strategic locations within the business gets this noticed, and the actions follow from there.”
At G.M. Precision, real-time data has allowed their team to react faster and provide more accurate updates to customers about production progress. “When it comes to updating customers on production progress, we’re now much more targeted with the information we share,” says Mathieu. “It also helps us better plan our production schedule.”
The best dashboard is not necessarily the one with the most information. It is the one that helps someone understand what requires attention and what to do next.
Real-time BI can support decisions across the manufacturing business. The most useful applications will depend on the company’s goals, processes, and current challenges.
Production dashboards can show job progress, machine status, labor activity, downtime, work-center performance, and other operational information.
This helps production managers recognize where work is slowing down, compare actual performance with production targets, and determine where changes are needed. By examining machine and work-center utilization, manufacturers can also identify underused capacity or processes that are limiting throughput.
Rather than relying on assumptions about how production is performing, managers can use current information to decide where to focus their attention.
Accurate scheduling depends on having reliable information about labor capacity, machine availability, materials, job progress, and production priorities.
BI tools help planners monitor the factors affecting the schedule and respond when conditions change. If a job is taking longer than expected, material has not arrived, or a machine becomes unavailable, the team can see the effect on production and adjust its plans.
Better visibility also makes it easier to provide customers with accurate timelines and identify orders that may be at risk of being delivered late.
Inventory data becomes more useful when it is connected with demand, purchasing, production, and upcoming jobs.
Manufacturers can use BI to monitor raw materials, work in progress, and finished goods; identify shortages; review overdue purchase orders; and determine which materials are needed for production. This helps purchasing teams prioritize supplier follow-ups and gives production planners a more accurate picture of what can be completed.
Over time, analytics can also help manufacturers examine usage patterns, supplier lead times, and inventory levels. These insights can support better purchasing decisions, reduce unnecessary inventory, and help prevent production delays caused by missing materials.
KPIs such as scrap, rework, non-conformances, and first-pass yield can reveal where quality problems are occurring.
Real-time visibility is particularly important here. If a scrap rate begins to rise, the production team may be able to pause the process, investigate the cause, and correct the issue before more time and materials are lost.
Historical analytics can then help the company identify recurring problems, compare results across jobs or processes, and determine whether corrective actions are producing better outcomes.
Manufacturers need to understand not only whether jobs are moving through production but whether they are profitable.
BI tools can help teams compare estimated and actual job costs, monitor labor and material usage, evaluate margins, and examine changes in expenses or cash flow. Managers can identify jobs that are moving over budget and investigate the cause while there may still be time to respond.
Historical information can also support future quoting and planning. By understanding where previous jobs gained or lost money, manufacturers can create more accurate estimates, adjust pricing, and make better decisions about similar work.
Business intelligence depends on reliable data. If information is divided between spreadsheets, disconnected applications, and departmental records, creating an accurate picture of the business becomes difficult.
An ERP system connects information from across the manufacturing operation. When production, inventory, purchasing, job costing, sales, and financial activity are managed within the same system, an ERP provides a strong foundation for reporting and analytics.
Instead of manually collecting information from multiple departments every time someone needs a report, manufacturers can use connected data to create dashboards and KPIs that update as employees complete transactions and record activity.
An ERP can also help provide consistency. Departments are working from the same records, definitions, and underlying information rather than maintaining separate versions of what happened.
Not every relevant piece of data will necessarily originate in the ERP. Machine-monitoring tools, spreadsheets, and other business systems may also contain valuable information. Manufacturers should therefore consider where their data comes from and whether their BI tools can combine the sources they need.
It can be tempting to measure everything, but too many KPIs can make it harder to recognize what matters.
Manufacturers should begin by identifying the decisions they need to make and the problems they are trying to solve. The right KPIs are the ones that help employees understand performance and take action.
Common manufacturing KPIs include:
Different roles within your manufacturing operation will require different information. A production manager may need to monitor job progress and machine availability, while a purchasing manager needs visibility into material requirements and overdue orders. Senior management may focus on profitability, delivery performance, capacity, and longer-term trends.
Dashboards should reflect those differences rather than presenting every user with the same information.
Manufacturers do not need to build the perfect set of dashboards on day one.
Mathieu’s advice is straightforward: “Start with simple indicators that make sense to you—and then improve your KPIs over time.”
Kaleb agrees and adds that it’s important to think about where your data is coming from. “My advice for anyone considering a BI solution is to first consider where your data sources are located and ensure that your BI solution can handle multiple data sources,” he says. “Often, what you think you want at first evolves along the way as you see the power of good data insights and what they can bring to your business.”
A company might begin with a small number of indicators related to a pressing operational issue, such as late jobs, material shortages, or scrap. Once employees become comfortable using that information, the company can refine its dashboards, introduce additional data, and expand BI into other areas.
Requirements will also change as people see what the data can reveal. A dashboard that initially answers one question may lead to new questions or show that another piece of information is needed.
The purpose of BI is not to create a fixed collection of reports. It is to help the business develop a better understanding of its operations and continue improving how decisions are made.
Real-time business intelligence gives manufacturers more than another way to report on performance. It gives teams the information they need to respond to problems, use resources more effectively, and improve results.
Both Stafford Engineering and G.M. Precision show that effective BI is not about getting everything perfect from the beginning. It is about making useful information visible, giving people the ability to act on it, and continuing to refine your approach.
Start with the decisions that matter most, choose a few meaningful KPIs, and build from there. The sooner you shift from reviewing what happened to using real-time insights to guide what happens next, the better equipped your business will be to improve performance.

"*" indicates required fields

AI technology built directly into ERP systems can help automate routine processes or create better user experiences by learning and adapting to user's language, allowing systems to better understand and respond to users.

See how our integration with HubSpot connects customer information, quotes and sales orders across both systems.
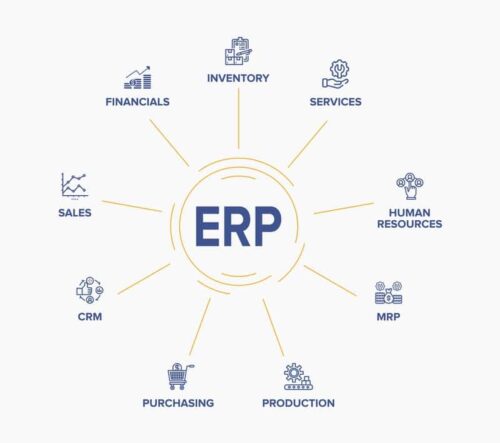
An ERP is business process management software that connects and integrates every aspect of a business — giving manufacturers visibility over their entire operation and allowing them to create better manufacturing processes, lower costs, and improve performance.

Give us a call to see how we’re different.

